

Real world evidence (RWE) is becoming increasingly important in rare disease research – yet identifying patients within real world data (RWD) remains a significant challenge. The complex diagnostic journeys and pathophysiology of most rare disorders complicates evidence generation and interpretation. These disorders often affect multiple organs, resulting in diverse clinical manifestations and heterogeneous patient populations. Furthermore, the lack of standardized diagnostic criteria and the presence of various known and unknown subtypes add to this complexity, making it difficult to reliably identify populations and measure outcomes in research.
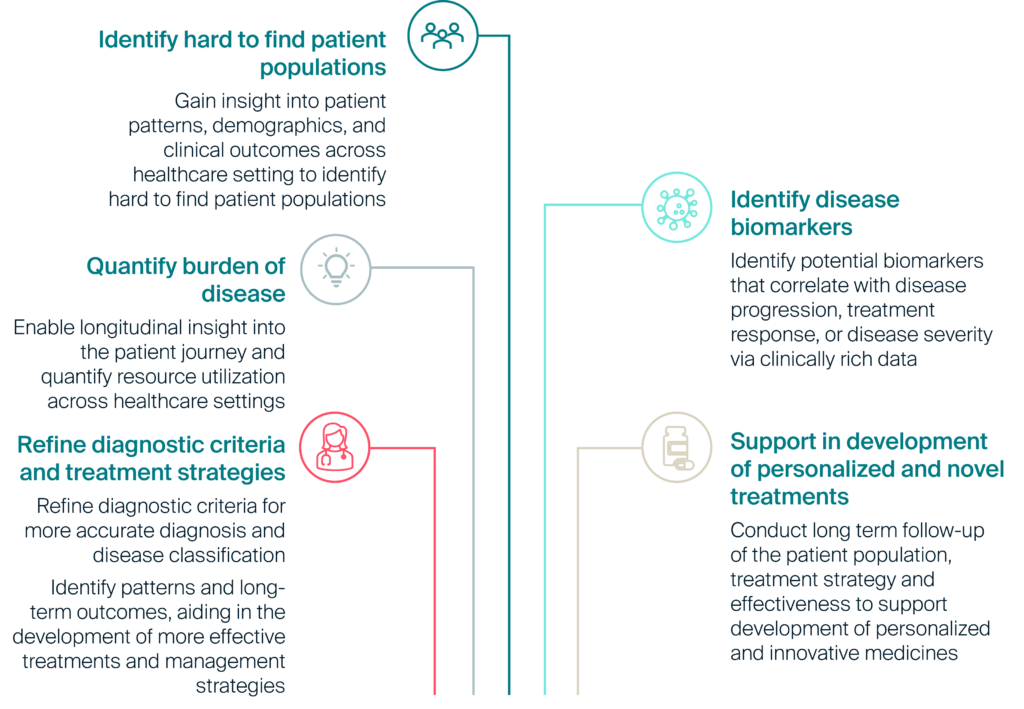
As advanced therapies emerge and decision-makers increasingly rely on RWE for regulatory approvals, coverage and reimbursement decisions, access to robust, longitudinal and clinical rich data sources is crucial (see Figure 1).
Figure 1: Use cases unlocked by innovative uses of real world data in rare disease research
Solving challenges in rare disease research
The PHARMO Data Network is a population-based data source of anonymous longitudinal electronic healthcare data from different primary and secondary healthcare settings in the Netherlands. This comprehensive network of structurally linked data from primary and secondary care settings (see Figure 2) enables cohort selection and case validation in hard-to-identify patient populations. When ICD-10 codes are not reliable or are too granular (and thus not routinely used in clinical practice), alternative approaches can be employed using the range of clinical variables readily available in this network. This includes pathology results (e.g. biopsy, cytology, histology), biomarkers, clinical lab results (e.g. blood, urine), and unstructured free-text notes from general practitioner setting. The PHARMO Data Network is regularly updated and expanded, ensuring the inclusion of new patients and follow-up information, providing a comprehensive view of patient health over time.
Figure 2: Linkages of the PHARMO Data Network
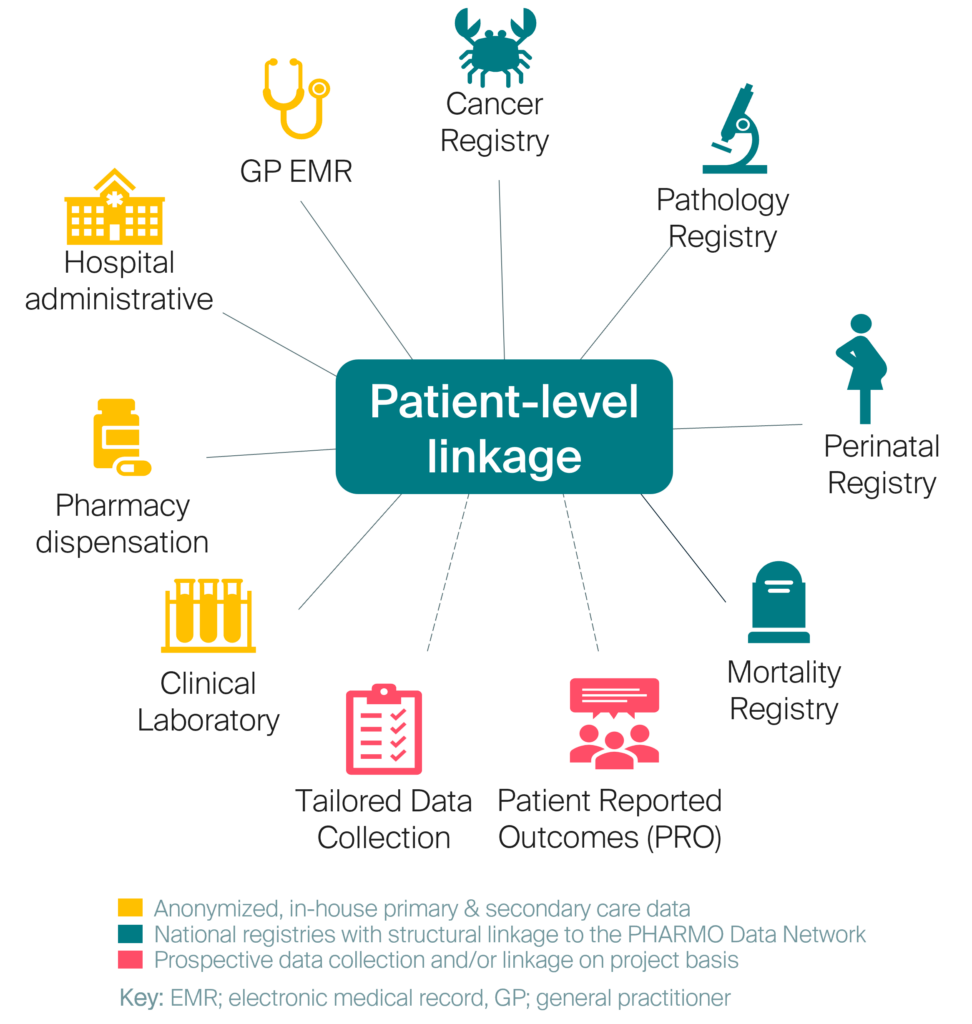
Table 1: Select examples of our rare disease research solutions
| Disease area | Our solution | Patient counts |
|---|---|---|
| Amyloidosis, including clinical subtypes; Systemic amyloidosis: 1. AL, 2. AA, TTR, ATTR-CM, ATTR-PN, hATTR, and ATTR-wt (see Factsheet) | Identified patients with amyloidosis-related hospital admission or ambulatory consultation. Data linkages available to enable further cohort validation include: – Biopsy results and gene sequences (from the Pathology Registry) – Troponin T and NT pro-BNP blood test results from clinical lab data | > 10,000 patients identified by an amyloidosis-related hospital admission or ambulatory consultation within the hospital database |
| Immunoglobulin A nephropathy (see Factsheet) | Identified patients from pathology lab data (including kidney biopsy) linked to out-patient pharmacy and hospital data. Clinical lab data available to further characterize the patient population | ~2,800 patients with pathologically confirmed IgAN identifiable within the Pathology Registry. ~900 patients with out-patient pharmacy and hospital data |
| Hemophilia A and Hemophilia B (see Factsheet) | Identified patients from hemophilia-related hospital admissions or discharge. Additional cohort validation from data linkages including complete blood count and clotting activity tests including fibrinogen. Genetic testing for Factor VIII and Factor IX genes are captured in pathology labs | ~800 patients with hemophilia A and ~90 with hemophilia B with a hemophilia-related hospital admission/ discharge or ambulatory consultation. Data captures 50% of the Dutch hemophilia population |
| Duchenne’s Muscular Dystrophy and Becker’s Muscular Dystrophy (see Factsheet) | Identified through diagnosis in general practitioner’s database. Additional variables available to validate the cohort include access to creatine kinase concentration testing and muscle biopsy results | ~200 patients identified with DMD and ~250 with BeMD diagnosis within GP database between 2003–2023. Data captures ~40% of DMD and ~50% of BeMD Dutch population |
| Hereditary Angioedema (see Factsheet) | Identified via diagnosis in GP setting and dispensing of HAE indicated medication from out-patient pharmacy | ~150 patients identified with HAE within the GP database and out-patient pharmacy between 1998–2023 |
Key: AA, amyloid A; AL, amyloid light chain; ATTR-CM, transthyretin amyloid cardiomyopathy; ATTR-PN, transthyretin amyloid peripheral neuropathy; ATTR-wt, wild-type transthyretin amyloidosis; BeMD, Becker’s Muscular Dystrophy;
DMD, Duchenne’s Muscular Dystrophy; GP, general practitioners; HAE, hereditary angioedema; hATTR, hereditary transthyretin amyloidosis; IgAN, immunoglobulin A nephropathy; TTR, transthyretin.
The PHARMO Institute has conducted advanced research in these rare diseases through studies addressing the following research questions (not exhaustive):
Improving classification of rare diseases:
Researchers can develop and test algorithms to improve the classification of rare diseases. This includes identifying suspected cases with greater sensitivity, specificity, and positive predictive value
Quantifying unmet needs:
Characterize the incidence, prevalence, treatment patterns, clinical outcomes, healthcare resource use and costs of management of these rare diseases. By generating deeper insights into burden of illness across the patient journey, researchers can better understand the true impact of these conditions on the patient and on the health system.
Validating trial surrogate endpoints:
With clinical trial follow-up periods often limited, healthcare decision-makers are seeking evidence of the correlation between those short-term trial endpoints and longer-term real-world outcomes. For example, researchers can demonstrate the links between outcomes such as progression-free survival, overall survival, time to assisted ventilation or renal response, providing valuable evidence for contextualizing the effectiveness of new treatments
Assessing the rate of long-term safety events:
Researchers should monitor patients over extended periods to identify and quantify the rate of adverse events that which may arise years after initial treatment (e.g. malignancy). This long-term assessment can aid researchers to detect patterns and trends in safety outcomes, evaluate the incidence and severity of side effects, and gain insights into the long-term impact of treatments
A multi-country approach
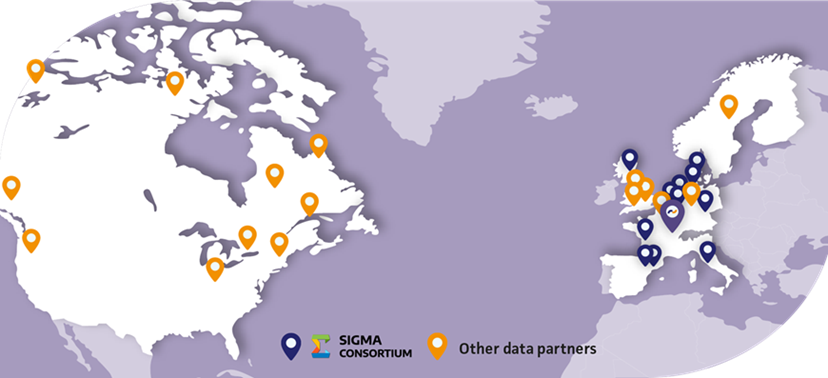
Lumanity’s RWE consulting team can assist you in identifying fit-for-purpose data in other countries through global data landscaping exercises. The PHARMO Institute, part of Lumanity, works with a trusted data partner network. This includes the SIGMA Consortium, a contract-based alliance of the European Network of Centres for Pharmacoepidemiology and Pharmacovigilance (ENCePP) research centers, which provides access to a wide array of administrative, clinical, and prescription data. This collaborative research initiative was designed to be the “go-to” organization for state-of-the-art methodological pharmacoepidemiology/RWE research. It was assembled to enable multi-country studies all using common analyses, to study responses to treatments in larger populations. The strength of our network lies in its ability to pragmatically and efficiently assess the “true” feasibility of rare disease research projects by leveraging the expertise of professionals who have an in-depth understanding of the health systems and care management pathways in their respective countries.
Figure 3: Lumanity global data partner network
Comprehensive data for better outcomes
Leveraging Lumanity’s extensive in-house data and networks can provide researchers with deeper insight into rare diseases, driving better patient outcomes, and facilitating the development and launch of innovative treatments.
We invite you to put our data to the test by sharing your feasibility questions with an expert member of our Research team.
Contact us to discuss your research queries further.