

Authored by BresMed, now part of Lumanity
Therapies designed to target cancers with specific molecular signatures have reshaped the landscape of oncological drug development.1 As the next generation of tumor-agnostic therapies make their way through clinical trials, we should be asking ourselves what we can do to prepare for the upcoming challenge of reimbursement in this space, and what lessons can be learnt from the experience of existing therapies. Over the coming months we will provide recommendations from our own experience and a review of the experiences of the tropomyosin receptor kinase (TRK) inhibitors (larotrectinib and entrectinib) on how to overcome the common challenges in this space in five short papers. Here, we look at what to consider when developing economic models of tumor-agnostic therapies, with a particular focus on the role of genetic testing in this space.
Selecting the model structure(s) that make best use of the data
For appraisals of interventions in advanced or metastatic cancers, partitioned survival analysis (PartSA) remains the most common modelling approach used, due to its simplicity and alignment with clinical trial endpoint reporting.2 Structural uncertainty in economic modelling is rarely explored due to time and resource limitations, despite the fact that the choice of structure may have a profound impact on cost-effectiveness results.3, 4
An independent report on the best methods to use when assessing tumor-agnostic therapies, commissioned by the National Institute for Health and Care Excellence (NICE), recommends the following:
‘Where there is substantive evidence of heterogeneity in treatment effects, consideration should be given to alternative model structures that are better able to reflect this heterogeneity including the use of landmark response approaches … a surrogate-based modelling approach informed by predictions from meta-analyses which capture all relevant uncertainty may be preferable to the extrapolation of heavily censored and potentially confounded progression-free survival and overall survival data.’5
The authors of this report recommended the bivariate random-effects meta-analysis approach outlined in the NICE Decision Support Unit (DSU) Technical Support Document (TSD) 20. This approach ensures that all uncertainty around the surrogate relationship is reflected in the predictions used in the model.5, 6 This advice is given for two reasons:
- The fact that the overall population is more heterogeneous may make it more challenging to fit a single conventional parametric curve
- The immaturity of the progression-free survival (PFS) and overall survival (OS) data will result in considerable uncertainty surrounding the extrapolated curves
The extent to which these problems apply in a given case will depend on the particular tumour-agnostic indication. If the survival data are relatively mature, then the methods discussed in our previous paper7 to account for heterogeneity can be used. However, if these data are extremely immature, then alternatives to directly extrapolating trial data will need to be explored. Such methods are likely to require manufacturer-directed data collection efforts in order to be sufficiently informative.
While their independent report may support the use of alternatives to a PartSA approach, NICE’s reaction in previous appraisals using response-based methods of prediction has not been encouraging (see right).8-10
In the submissions of the TRK inhibitors entrectinib11 (by Roche) and larotrectinib12 (by Bayer) to NICE (which were produced before publication of the independent report), both manufacturers submitted a three-state PartSA model based upon a naïve comparison to previous NICE appraisals of last-line treatments. The method of implementation of this comparison varied across manufacturers; Roche used median survival information, whereas Bayer used parametric models for each comparison. The committee considered Roche’s approach to be pragmatic – if not ideal. In combination with alternative modelling methods used to estimate comparator survival, the PartSA approach was, in the end, considered by NICE to be suitable for decision-making. In other jurisdictions and later publications, the use of partitioned survival modelling remains standard practice.13-15
As with the construction of any economic model, the best advice is to carefully consider the structure of the model during the conceptualization stage and clearly present the justification for the eventual decision in later documentation. If alternatives to a PartSA approach are considered more appropriate, we would recommend that the PartSA continues to be presented alongside the preferred approach.
The final challenge to remember when constructing an economic model in the tumor-agnostic space is the sheer volume of analyses likely to need conducting, due to:
- Multiple tumor types and potentially also placements within the pathway
- Multiple comparators, which may differ by geography
- Multiple data sources and approaches that could potentially be used to compare treatments
- Multiple potential model structures
- The need to perform complex statistical analyses to account for heterogeneity
- The desire to conduct value-of-information and pricing analyses to inform decision risk and potential managed access and pricing schemes
In addition to the volume of individual analyses possible, it is quite likely that methods such as model-averaging to integrate structural uncertainty into a final incremental cost-effectiveness ratio (ICER) estimate will be of interest.16, 17
All these analyses require careful consideration before programming. Otherwise, the model is likely to become unwieldy – an issue that a) causes decision-makers to view a model as unreliable and lacking transparency, and b) leads to major issues for the manufacturer’s modelers when questions arrive from health technology assessment (HTA) bodies.
Optimizing Excel-based models
The vast majority of health economic models are still constructed in Microsoft Excel®. This software has one advantage in that it is commonly used by healthcare decision-makers; because of this familiarity, many HTA bodies still require submission in Excel. If this were not the case, we would not be recommending the use of Excel for submission for this particular decision problem, as it is not well suited to handling the complexity of multiple indications and potential comparator data sources.16, 18
Given this, in the planning phases, we would recommend the use of more suitable software such as R19 for model construction. This software allows complex statistical analyses (such as Bayesian hierarchical modelling) to be fully integrated with economic evaluation analyses, allowing much greater flexibility for scenario testing before construction of the submission model.
We have presented a few tips below to optimize Excel model construction as much as possible:
Consider the economic model as a standalone document. Cite sources, name ranges and describe the calculations and assumptions accordingly
Understand and account for the functional limitations of the software used. Excel is unlikely to be able to handle the formulae required for a patient flow sheet for each possible tumor type, placement and comparison. Instead, you will need to consider a programmatic approach, using one patient flow to cycle through tumor types, placements, comparisons, or all three. This requires data input to follow the same logic and avoidance of passing back and forth between Visual Basic® for Applications (VBA) and Excel within code, particularly later when it comes to sensitivity analyses
Build big, but consider later adaptations. Set up the global model for all expected comparisons, placements within the pathway and tumor types; organize with functionality to strip out unneeded information for country submissions automatically where possible
Avoid volatile functions, array formulae and conditional formatting. These slow Excel down
Consider how to fully capture uncertainty. Traditionally, multivariate-normal sampling using parameter variance–covariance matrices is used to capture uncertainty for correlated parameters in economic models. Bayesian outputs, however, do not align with such methods, as they require uncertainty to be simulated across all of the tumor sites simultaneously. Thus, novel and potentially computationally intensive methods may be required to incorporate the outputs of uncertainty analysis using these simulations (similar to those used to fully incorporate Bayesian network meta-analysis)
Present internal and external validation checks within the economic model, as opposed to in a separate file or program
Incorporating genetic testing into the model
The role of genetic testing in cancer is two-fold: firstly, to detect the presence or absence of a specific mutation; and secondly, to determine whether the mutation is acting as an oncogenic driver or whether it is merely a passenger mutation in tumourigenesis.5 There are a variety of tests available – the advantages and disadvantages of each are summarized in the table below.
Summary of features of genetic tests used in cancer treatment
| Test | Approximate cost of testing ($USD) | Accessibility | Sensitivity5 | Specificity5 |
|---|---|---|---|---|
| DNA-based NGS | $200–300 for targeted panels $600–2,000 for exome sequencing $2,900–4,800 for whole genome sequencing20-24  | The use of targeted panels is becoming increasingly common, either in a clinical trial context or in clinical practice for specific variants in specific tumor types. Access still varies considerably by geographical location and by tumor type. | 81.1%5 | 99.86% |
| RNA-based NGS | $1,000–4,00025,26 | RNA sequencing is not part of standard diagnostic genetic testing | 100% | 100% |
| IHC | $40–14025,27 | Routinely used | 87.9% | 81.1% |
| FISH | $500–60028 | Routinely used | 80.0% | 100% |
| RT-PCR | $400–50028 | Routinely used | 98%28 | 89%28 |
Notes: Features of the tests are rated according to the effect they currently have on the development of a diagnostic paradigm for tumor-agnostic therapies. A teal tick indicates that the feature is helpful; a yellow line indicates it is somewhat prohibitive; and a red cross indicates it is very prohibitive. Sensitivity refers to the true positive rate, whereas specificity refers to the true negative rate.
Genetic tests may be combined as part of an overall testing strategy, where they are conducted to verify that a particular molecular alteration is present in the tumour and/or a particular gene or protein is overexpressed. This allows for diagnostic accuracy to be maintained, while reducing the use of more expensive and resource-intensive test types.
Set-up, availability and equity of access
In recent years, we have seen substantial investment in and changes to genomic testing services for cancer. 2020 saw game-changing advancements in next-generation sequencing (NGS) workflow solutions, defining a new era in mutation testing, early detection, liquid biopsy, pan-cancer in vitro diagnostic assays, blockchain-based direct-to-consumer services29, 30 and applications in the fight against COVID-19.29 This growth is set to continue, with the NGS market being projected to reach USD $24.2 billion by 2026 from $10.3 billion in 2021.31
Unfortunately, the use and delivery of genetic services has not kept pace with technological advancement.32 In most countries, genetic services are either lacking or only in the early stages of development.
While most health systems acknowledge the need to roll out high-quality NGS – with some countries making firm commitments to do so – access to and reimbursement for such testing remain limited.33
The need for testing to implement tumor-agnostic technologies has several consequences for economic evaluation, including:
- The potential need for and feasibility of expanding testing services, and the question of who should pay for this
- The cost and resource implications associated with conducting tests, once services are set up
- The potential need to consider multiple testing strategies
- The implications for equity of access
The costs associated with identifying patients eligible for tumour-agnostic treatment based on molecular markers will be driven by a range of factors, including the testing strategy adopted and the current level of provision. These are likely to vary across geographies and tumour types; in particular, the rarer the target genetic mutation, the higher the cost of identifying eligible patients.
Imagine a test costing $1,000, with a demonstrated sensitivity and specificity of 100%. For a mutation with a prevalence of 90%, the cost per patient identified for tumors with this mutation is only $1,111. If the prevalence is much lower (0.2%), the cost per patient rises to $50,000. This range in prevalence of mutation is what was seen for NTRK gene fusions, making this a realistic and highly relevant scenario to anticipate in future tumor-agnostic economic evaluations.
Who pays?
The question of who should pay for the implementation of wide-scale genomic testing is a source of ongoing debate. When a new therapy needs a new test or increased provision of an existing test, one approach is to allocate the full cost of testing to the first manufacturer to market. While this may be an accurate reflection of the decision facing the HTA authorities – as the new treatment cannot be used without the test – this places an additional barrier on patient access.
The HEcoPerMed (Healthcare- and pharma-economics in support of the International Consortium for Personalised Medicine) guidelines recommend exactly this34: the onus should fall on the first mover, a recommendation broadly in line with the experience of the TRK inhibitors. This misses the fact that in many ways, wide-scale genomic testing can be considered a public good, especially as more and more targeted therapies become available; widespread panel testing is likely to allow for multiple new treatment options.
While calculation of the benefits arising is undoubtably complicated35, 36, completely ignoring these benefits does not appear to be justifiable either. As research into and implementation of genetic testing programmes continue, techniques such as threshold analysis could be used in technology appraisals to determine the proportion of the cost of testing needed to fall on the manufacturer in order to make implementation of the technology no longer cost-effective. The decision on whether the allocation of the cost is worth it would then be based on qualitative judgement of the likely benefits from wider testing.
Where multiple manufacturers are coming to request reimbursement within similar timeframes, any increase in testing costs should be shared across manufacturers. HTA bodies should seek to implement solutions to allow this, particularly as there are fewer practical challenges associated with sharing these costs than there are for price negotiation for combination therapies. With respect to the latter, progress is finally being made in this area, with the recent Association of the British Pharmaceutical Industry (ABPI) pilot and various proposals of methodologies for value attribution and arbitration.37, 38
Modeling the economic consequences of testing
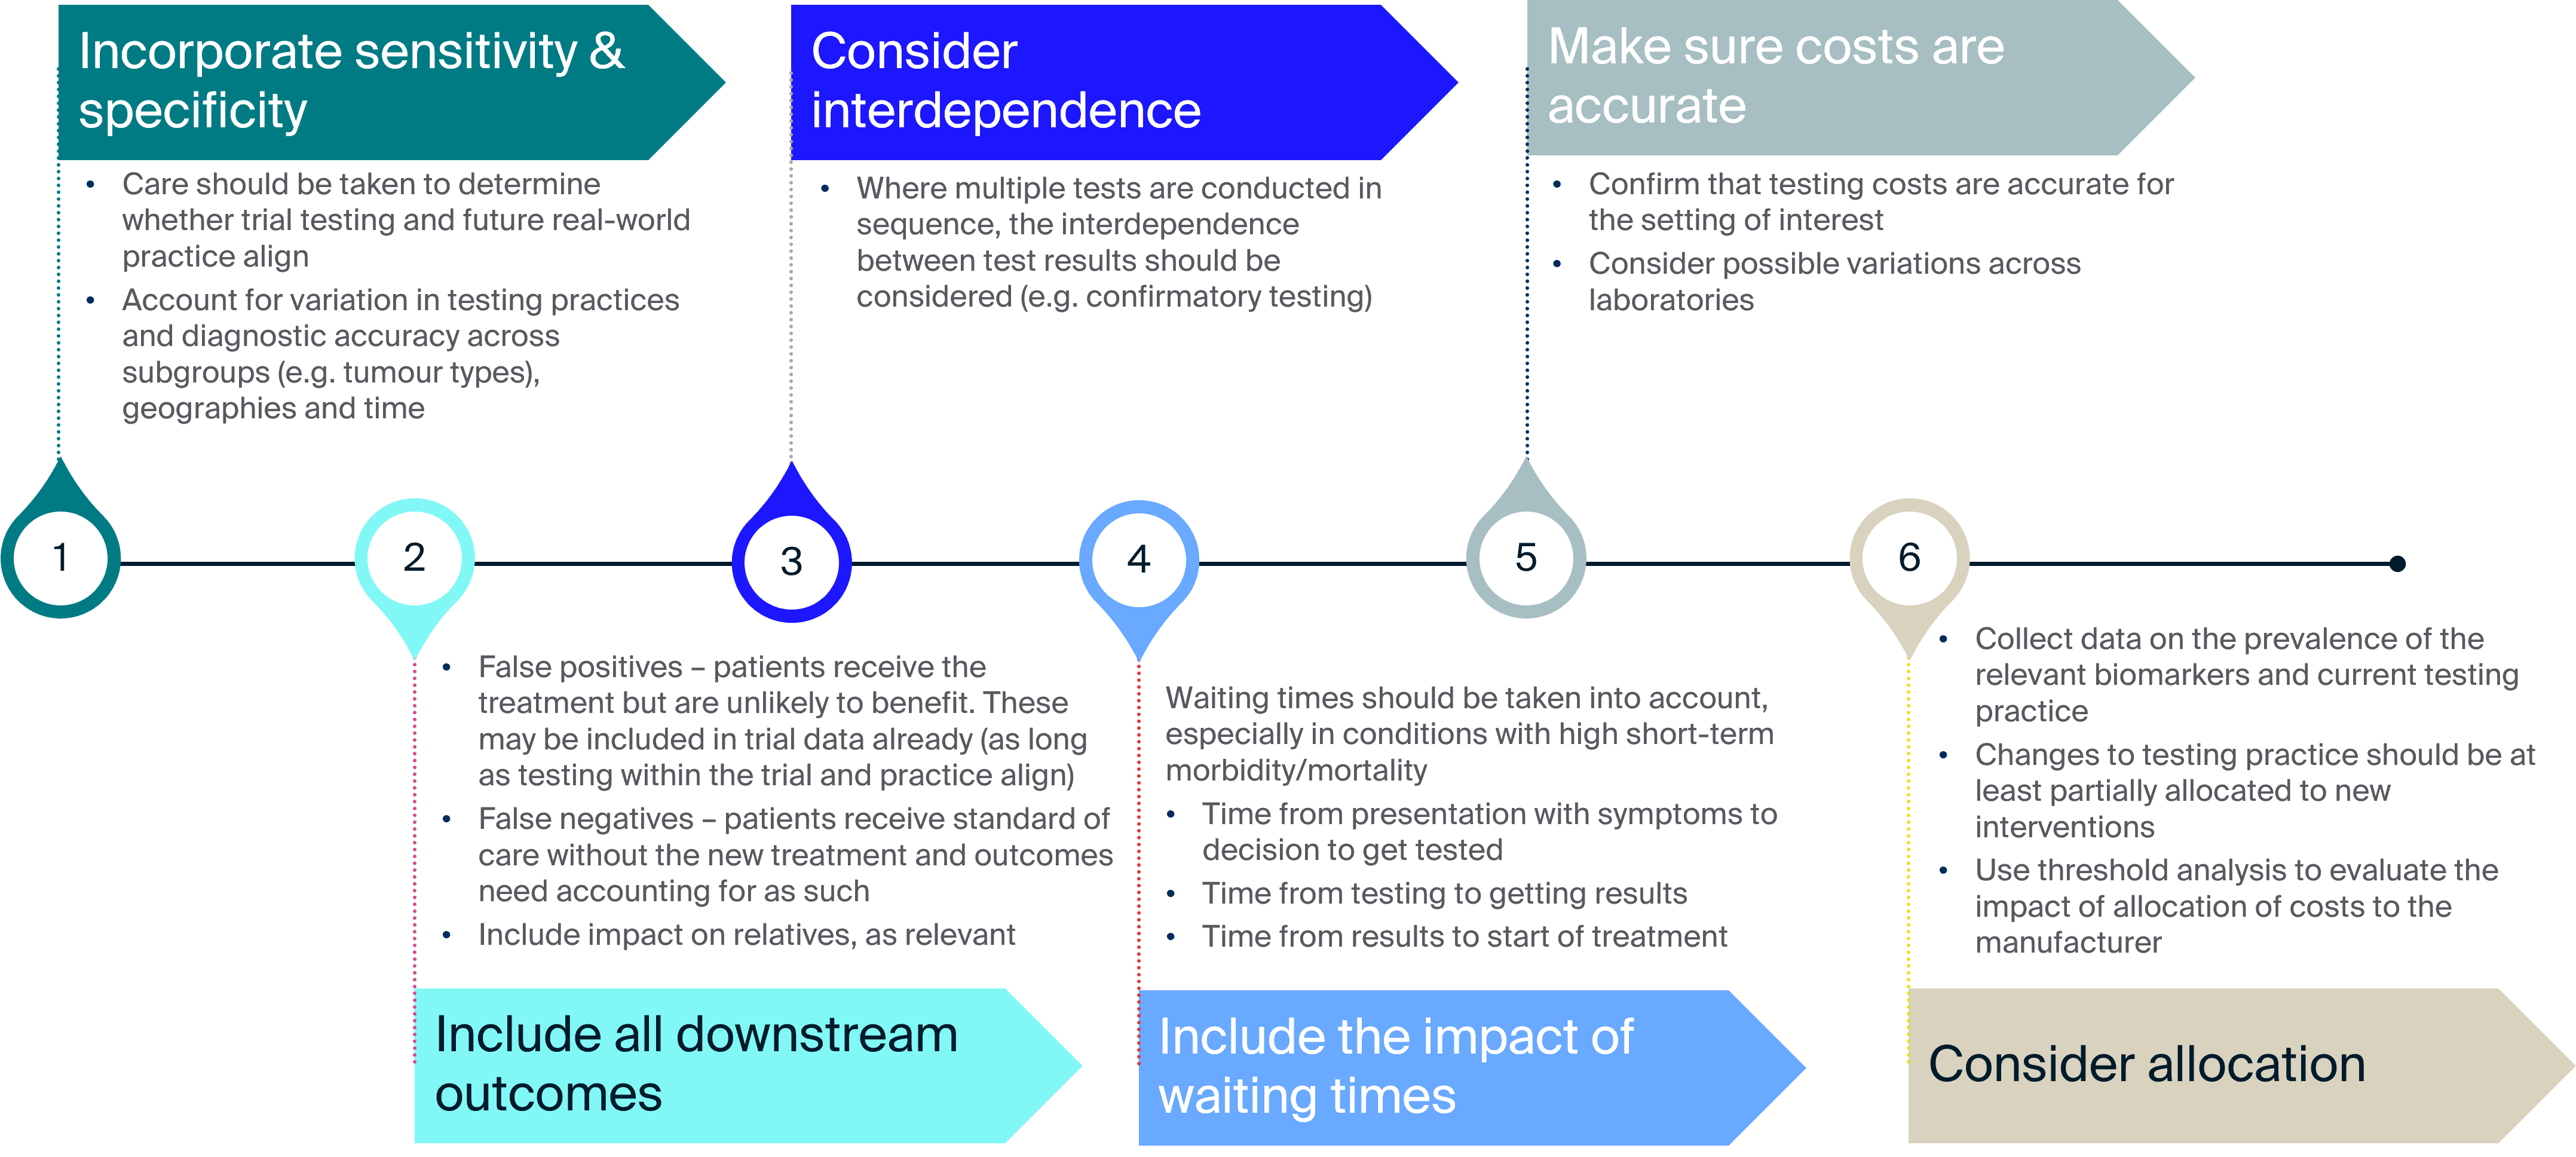
The HEcoPerMed guidelines provide useful information on how the economic costs of testing should be incorporated34:
“The committee noted it had not seen any firm evidence to show that the response-based model was an adequate method to model long-term outcomes.”
NICE TA530 final appraisal document, page 10.8
Until NGS becomes a standard part of cancer treatment protocols, access to testing will remain a major barrier to tumor-agnostic therapy uptake and equity of outcomes for patients.
Key points to consider
Consider alternative model structures and justify your final selection
- A surrogate-based modelling approach informed by predictions from meta-analyses may be preferable to the extrapolation of heavily censored PFS and OS data. However, such an approach would require additional data collection outside of the clinical trial to inform predictions
- Present outcomes using a PartSA approach alongside any alternatives
- Thoroughly explore structural uncertainty, and consider the use of quantitative techniques such as model averaging to incorporate this into the final presented cost-effectiveness estimate
- Consider the use of more suitable software such as R, particularly in early economic modelling
- Where Excel is needed, consider the volume of comparisons and complexity of analyses upfront within the programming specification
Identify current testing practice
- This is likely to vary across tumor types and geographies
Include the full costs and consequences of new or increased testing in the economic analysis
- Consider using techniques such as threshold analysis to determine the proportion of the cost of testing needed to fall on the manufacturer in order to make implementation of the technology no longer cost-effective – with the decision on whether the allocation of the cost is worth it based on qualitative judgement of the likely benefits from wider testing
- Where multiple interventions are coming to market using the same testing techniques, discuss with HTA bodies the potential to share costs across companies and the practicalities around this
References
- Offin M, Liu D and Drilon A. Tumor-Agnostic Drug Development. American Society of Clinical Oncology Educational Book. 2018; (38):184-7.
- Woods BS, Sideris E, Palmer S, et al. Partitioned survival and state transition models for healthcare decision making in oncology: Where are we now? Value Health. 2020; 23(12):1613-21.
- Cranmer H, Shields GE and Bullement A. A comparison of partitioned survival analysis and state transition multi-state modelling approaches using a case study in oncology. J Med Econ. 2020; 23(10):1176-85.
- Smare C, Lakhdari K, Doan J, et al. Evaluating partitioned survival and Markov decision-analytic modeling approaches for use in cost-effectiveness analysis: Estimating and comparing survival outcomes. PharmacoEconomics. 2020; 38(1):97-108.
- Murphy P, Glynn D, Dias S, et al. Modelling approaches for histology-independent cancer drugs to inform NICE appraisals. 2020. (Updated: 28 February 2020) Available at: https://www.nice.org.uk/Media/Default/About/what-we-do/Research-and-development/histology-independent-HTA-report-1.docx. Accessed: 11 January 2022.
- Bujkiewicz S, Achana F, Papanikos T, et al. NICE DSU Technical Support Document 20: Multivariate meta-analysis of summary data for combining treatment effects on correlated outcomes and evaluating surrogate endpoints. 2019. (Updated: 22 October 2019) Available at: http://nicedsu.org.uk/multivariate-meta-analysis-tsd/. Accessed: 11 January 2022.
- Lee D, Madin-Warburton M, Horgan J and Brears N. Heterogeneity & generalizability: The core difficulties in estimating the effectiveness of tumour-agnostic drugs in practice. 2021. Available at: https://www.bresmed.com/home/our-publications/heterogeneity-generalizability-the-core-difficulties-in-estimating-the-effectiveness-of-tumour-agnostic-drugs-in-practice/. Accessed: 17 January 2022.
- National Institute for Health and Care Excellence (NICE). [TA490] Nivolumab for treating squamous cell carcinoma of the head and neck after platinum-based chemotherapy 2017. Available at: https://www.nice.org.uk/guidance/ta490. Accessed: 11 January 2022.
- National Institute for Health and Care Excellence (NICE). [TA530] Nivolumab for treating locally advanced unresectable or metastatic urothelial cancer after platinum-containing chemotherapy. 2018. Available at: https://www.nice.org.uk/guidance/ta530. Accessed: 11 January 2022.
- National Institute for Health and Care Excellence (NICE). [TA558] Nivolumab for adjuvant treatment of completely resected melanoma with lymph node involvement or metastatic disease. Final appraisal document (uploaded to TA684 webpage). 2018. Available at: https://www.nice.org.uk/guidance/ta684/documents/html-content-4. Accessed: 18 January 2022.
- National Institute for Health and Care Excellence (NICE). [TA644] Entrectinib for treating NTRK fusion-positive solid tumours. 2020. (Updated: 12 August 2020) Available at: https://www.nice.org.uk/guidance/ta644. Accessed: 27 January 2022.
- National Institute for Health and Care Excellence (NICE). [TA630] Larotrectinib for treating NTRK fusion-positive solid tumours. 2020. (Updated: 27 May 2020) Available at: https://www.nice.org.uk/guidance/ta630. Accessed: 27 January 2022.
- Briggs A, Wehler B, Gaultney JG, et al. Comparison of Alternative Methods to Assess the Cost-Effectiveness of Tumor-Agnostic Therapies: A Triangulation Approach Using Larotrectinib as a Case Study. Value in Health. 2021.
- Canadian Agency for Drugs and Technologies in Health (CADTH). Larotrectinib. 2021. (Updated: 12 November 2021) Available at: https://www.cadth.ca/larotrectinib. Accessed: 18 January 2022.
- Tandvårds- och läkemedelsförmånsverket (TLV). Rozlytrek (entrektinib). 2021. Available at: https://www.tlv.se/download/18.2598f33b179cefa2b4016fc9/1622807640538/bes210520_rozlytrek_underlag.pdf. Accessed: 18 January 2022.
- Hart R, Burns D, Ramaekers B, et al. R and Shiny for Cost-Effectiveness Analyses: Why and When? A Hypothetical Case Study. PharmacoEconomics. 2020; 38(7):765-76.
- Hardern C, Lee D, Sly I and Kearns B. EX2 Structural Uncertainty in Survival Extrapolation: Exploring the IMPACT of FOUR MODEL Averaging Methods and Adjusting for DATA Maturity. Value in Health. 2020; 23:S402.
- Lee D, Hart R, Burns D, et al. ‘Excel cannot complete this task’: Drawing parallels between UK Test and Trace and health economic models. 2020. Available at: https://www.bresmed.com/home/our-publications/wp-1020-excel-cannot-complete-this-task-drawing-parallels-between-uk-test-and-trace-and-health-economic-models/. Accessed: 18 January 2022.
- The R Foundation. The R Project for Statistical Computing. 2022. Available at: https://www.r-project.org/. Accessed: 12 January 2022.
- Gordon LG, White NM, Elliott TM, et al. Estimating the costs of genomic sequencing in cancer control. BMC Health Serv Res. 2020; 20(1):492.
- Doostparast Torshizi A and Wang K. Next-generation sequencing in drug development: target identification and genetically stratified clinical trials. Drug Discov Today. 2018; 23(10):1776-83.
- Yohe S, Hauge A, Bunjer K, et al. Clinical validation of targeted next-generation sequencing for inherited disorders. Arch Pathol Lab Med. 2015; 139(2):204-10.
- Facts and Factors. Global Next Generation Sequencing Market Projected Reach Above USD 12,624.3 Million by 2026. 2021. Available at: https://www.fnfresearch.com/news/global-next-generation-sequencing-ngs-market-revenue-projected. Accessed: 11 January 2022.
- Matthijs G, Souche E, Alders M, et al. Guidelines for diagnostic next-generation sequencing. Eur J Hum Genet. 2016; 24(1):2-5.
- Tsao MS and Yatabe Y. Old soldier never die: Is there still a role for immunohistochemistry in the era of next-generation sequencing panel testing? J Thorac Oncol. 2019; 14(12):2035-8.
- Centers for Medicare & Medicaid Services (CMS). 21CLABQ2. 2021. (Updated: 13 April 2021) Available at: https://www.cms.gov/medicaremedicare-fee-service-paymentclinicallabfeeschedclinical-laboratory-fee-schedule-files/21clabq2. Accessed: 11 January 2022.
- Dial S. Immunohistochemistry: What Is It and What Does It Tell Us? British Small Animal Veterinary Congress. Birmingham, UK. 3–6 April 2008.
- Schluckebier L, Caetano R, Garay OU, et al. Cost-effectiveness analysis comparing companion diagnostic tests for EGFR, ALK, and ROS1 versus next-generation sequencing (NGS) in advanced adenocarcinoma lung cancer patients. BMC Cancer. 2020; 20(1):875.
- Chen X, Kang Y, Luo J, et al. Next-generation sequencing reveals the progression of COVID-19. Front Cell Infect Microbiol. 2021; 11(142).
- Research and Markets. Global Clinical Next-Generation Sequencing (NGS) Market Report 2021: Next-generation Blockchain-Powered Genomic Data Marketplaces are Creating New Growth Opportunities. 2021. (Updated: 9 March 2021) Available at: https://finance.yahoo.com/news/global-clinical-next-generation-sequencing-113800535.html. Accessed: 11 January 2022.
- Globe Newswire. The next-generation sequencing market is projected to reach USD 24.2 billion by 2026 from USD 10.3 billion in 2021, at a CAGR of 18.7%. 2021. Available at: https://www.globenewswire.com/news-release/2021/04/26/2216523/0/en/The-next-generation-sequencing-market-is-projected-to-reach-USD-24-2-billion-by-2026-from-USD-10-3-billion-in-2021-at-a-CAGR-of-18-7.html. Accessed: 11 January 2022.
- MarketsandMarkets. Next-generation Sequencing (NGS) Market by Product & Service (Consumables, Platforms, Services, Bioinformatics), Technology (SBS, SMRT), Application (Diagnostic, Drug Discovery, Agriculture), End User (Pharma, Biotech, Academic) – Global Forecast to 2026. 2021. Available at: https://www.marketsandmarkets.com/Market-Reports/next-generation-sequencing-ngs-technologies-market-546.html. Accessed: 14 January 2022.
- Kearney. Preparing health systems for tumor-agnostic treatment. 2019. Available at: https://www.de.kearney.com/health/article/?/a/preparing-health-systems-for-tumour-agnostic-treatment. Accessed: 11 January 2022.
- Vellekoop H, Huygens S, Versteegh M, et al. Guidance for the harmonisation and improvement of economic evaluations of personalised medicine. PharmacoEconomics. 2021; 39(7):771-88.
- Spackman E, Hinde S, Bojke L, et al. Cost-effective analysis of genomic tests: what are the methods challenges? 2015. Available at: http://www.eepru.org.uk/article/cost-effective-analysis-of-genomic-tests-what-are-the-methods-challenges/. Accessed: 11 January 2022.
- Buchanan J, Wordsworth S and Schuh A. Issues surrounding the health economic evaluation of genomic technologies. Pharmacogenomics. 2013; 14(15):1833-47.
- Takeda. Combination Treatments – Our proposal. 2021. Available at: https://www.takeda.com/en-gb/what-we-do/combination-treatments/. Accessed: 19 January 2022.
- Latimer NR, Pollard D, Towse A, et al. Challenges in valuing and paying for combination regimens in oncology: reporting the perspectives of a multi-stakeholder, international workshop. BMC Health Serv Res. 2021; 21(1):412.